The Reality of Q3/Q4 Marketing Growth Metrics
Tracking Q3/Q4 marketing growth metrics requires managers to shift focus from slow, manual data entry to analyzing high-volume Top of Funnel signals.
The second half of the year operates at a completely different speed. You finish your summer campaigns and suddenly Black Friday and end-of-year wrap-ups aggressively demand your attention. Marketing managers often panic during this shift and fall back on outdated spreadsheets. They pull data from Google Analytics, export CSVs from Sprout Social, and try to manually stitch a cohesive story together.
This manual reporting habit kills your team's momentum. You spend eighty percent of your week looking at historical data instead of launching new experiments.
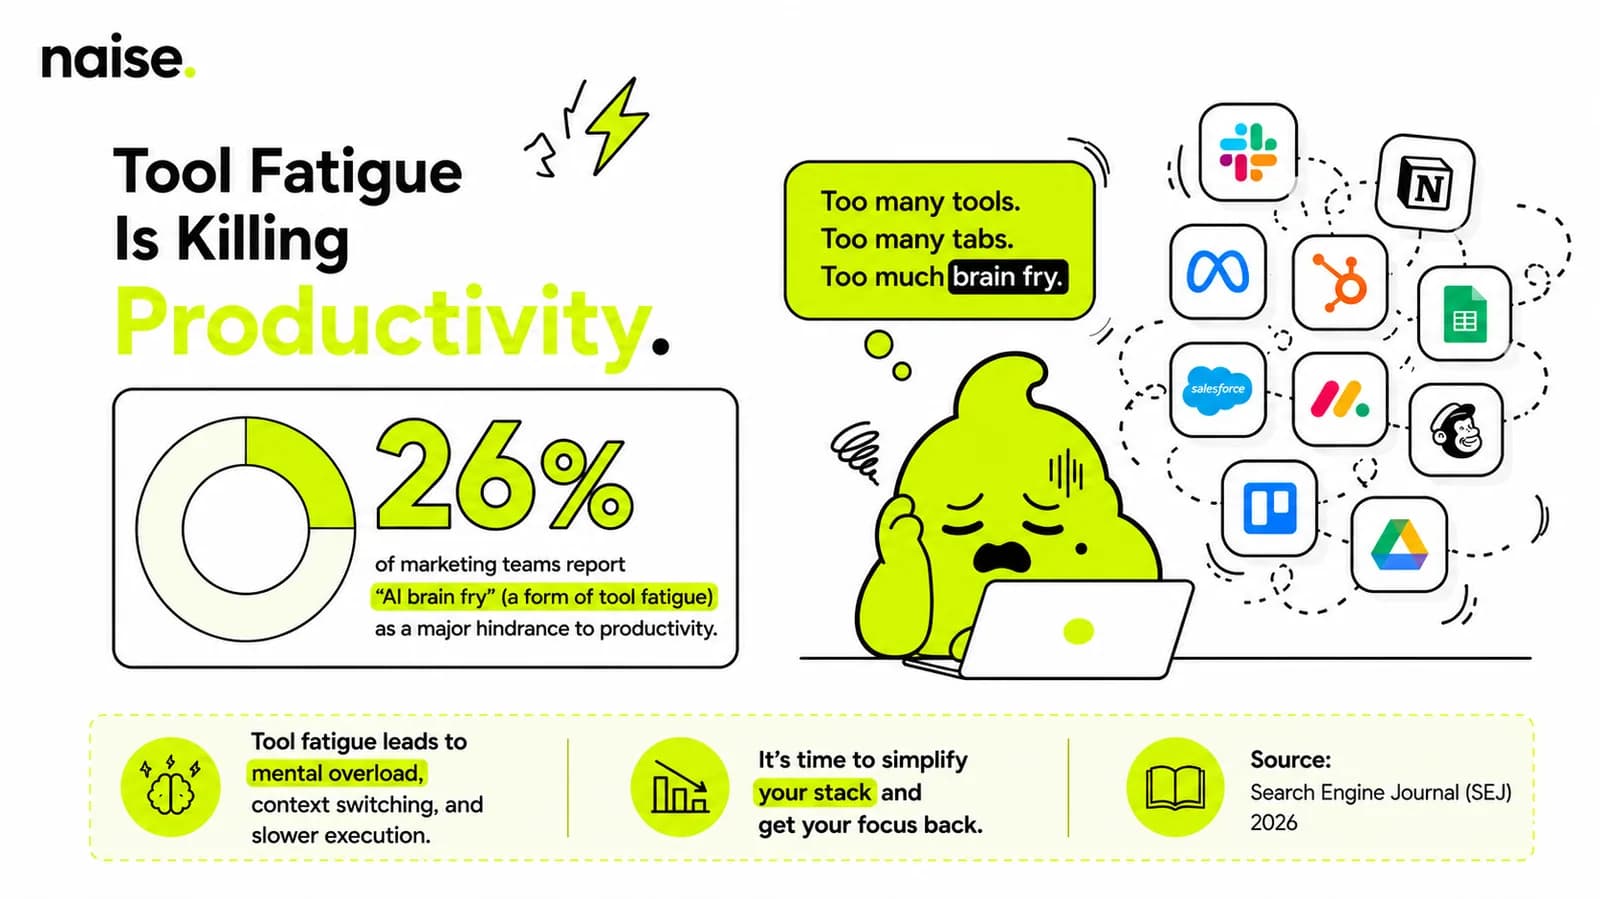
Managers need a leaner approach to track the Customer Journey efficiently.
You must focus exclusively on metrics that indicate forward movement. If a metric does not tell you exactly what to change in your next post, you should drop it from your weekly review. Let us look at the core Top of Funnel numbers you actually need to monitor.
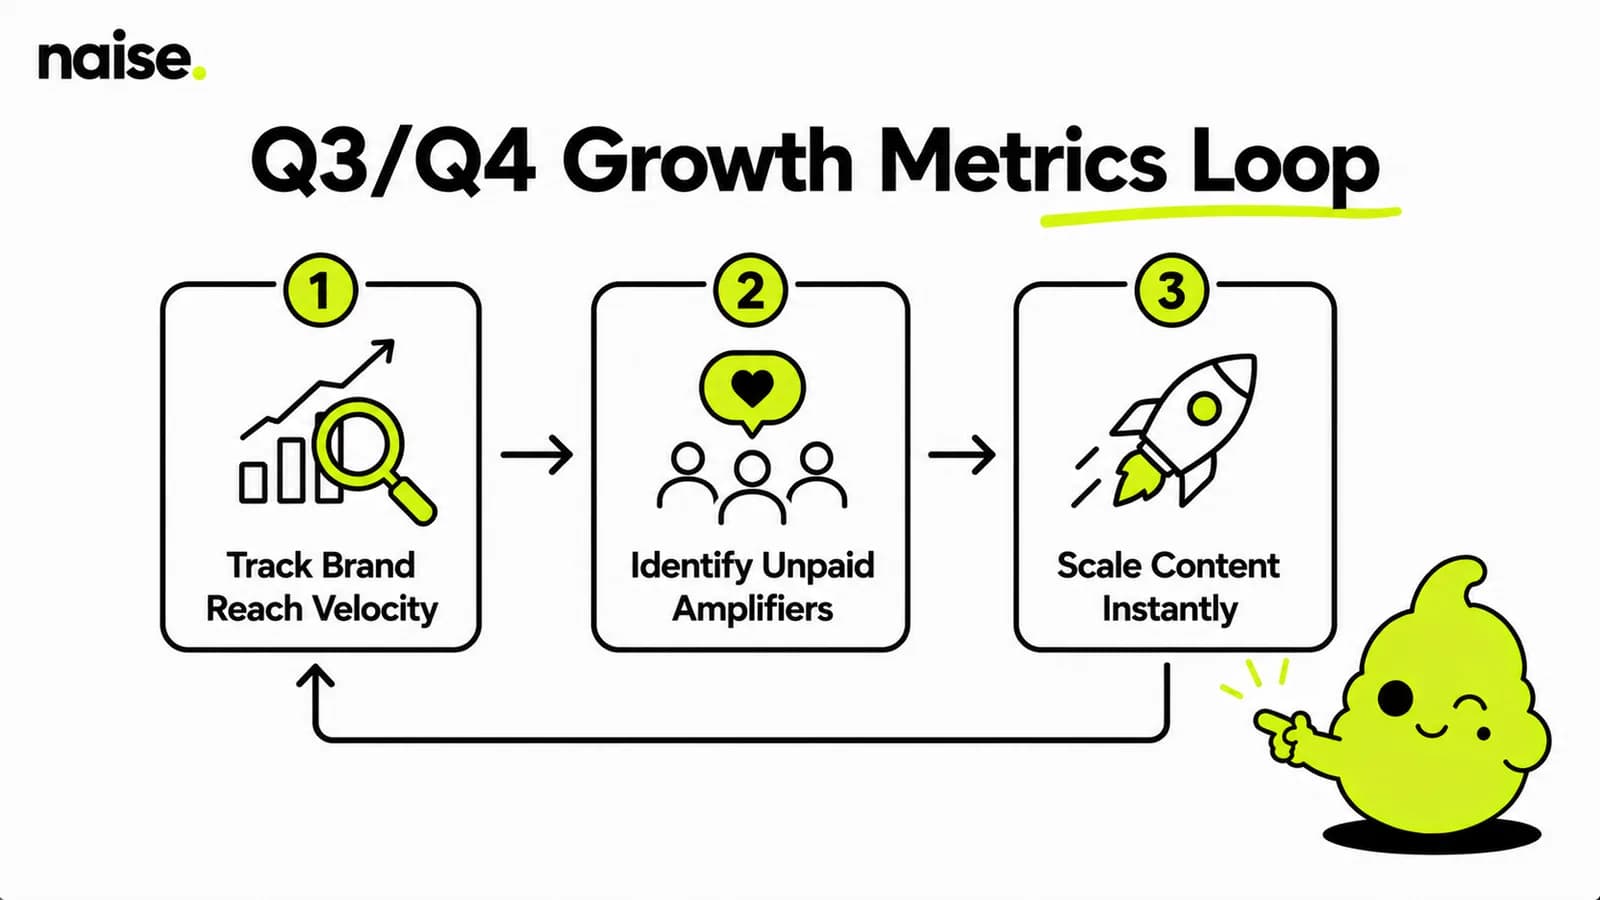
Tracking Brand Reach Velocity
Brand Reach Velocity measures how quickly your organic content spreads across new audiences over a specific timeframe.
Most teams look at total follower count and call it a day. That number is a static vanity metric that tells you nothing about current momentum. You need to measure the speed at which your Organic Reach expands week over week. If you post three times a week on TikTok and LinkedIn, you must track the percentage of non-followers seeing that content.
A high velocity means your hooks are working and algorithms favor your formats. A flat or negative velocity means your creative assets are stale. Scaling your visual output is the only way to fix a stagnant reach. You have to feed the algorithms fresh, high-quality concepts continuously.
Measuring Unpaid Amplifier Rate
The Unpaid Amplifier Rate tracks the volume of users organically sharing, remixing, or heavily engaging with your brand without financial incentives.
Paid ads guarantee eyeballs, but they drain your Customer Acquisition Cost fast. You want to see how many people willingly advocate for your product for free. This includes organic User Generated Content (UGC), brand mentions in comments, and direct shares. When this metric spikes, your Brand Positioning is resonating perfectly with the market.
Managers often struggle to track this because it requires scraping hundreds of comment sections and hashtags. You need a systematic way to flag these amplifiers and build relationships with them. Identifying these super-fans early sets up your Influencer Marketing pipeline for the following year.
Fragmented Stack vs All-in-One Operations
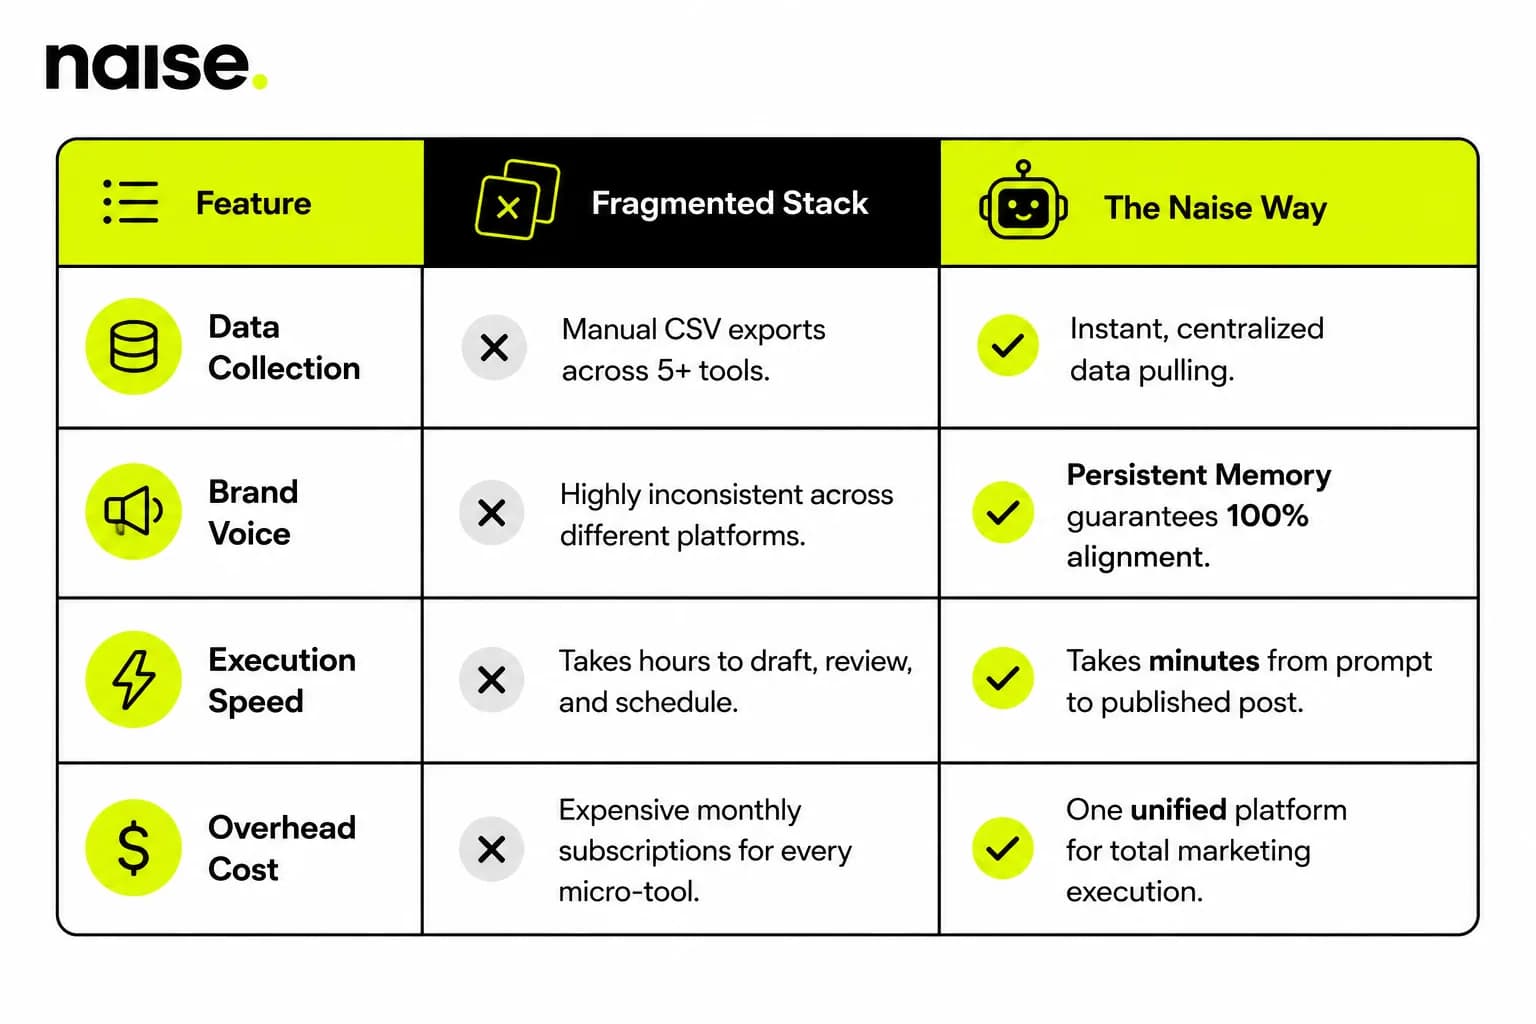
Consolidating your tools eliminates context switching and provides a single source of truth for all Marketing Analytics.
Relying on a dozen different platforms to track your growth metrics guarantees data discrepancies. Your HubSpot dashboard will show one number, while your native social analytics show another. This friction slows down decision-making.
Hit Your Growth Targets With Naise AI
Naise AI automates your content execution and tracks performance so you can focus entirely on high-level growth strategy.
You know exactly which Q3 Q4 marketing growth metrics to track. Now you need the execution power to actually move those numbers without hiring a dozen freelancers. Naise AI is your 24/7 AI Marketing Operator built specifically to eliminate manual grunt work. We replace your fragmented stack with a unified, highly intelligent ecosystem.
Here is exactly how you scale your metrics effortlessly:
Establish Persistent Memory: Upload your brand guidelines, past performance PDFs, and tone of voice documents into Projects. The AI learns your brand DNA once and never forgets it.
Bypass Prompt Fatigue: Open the Naise Chat and select a pre-configured Playbook. Choose the "Post from a brand pillar" template to instantly generate high-converting social copy.
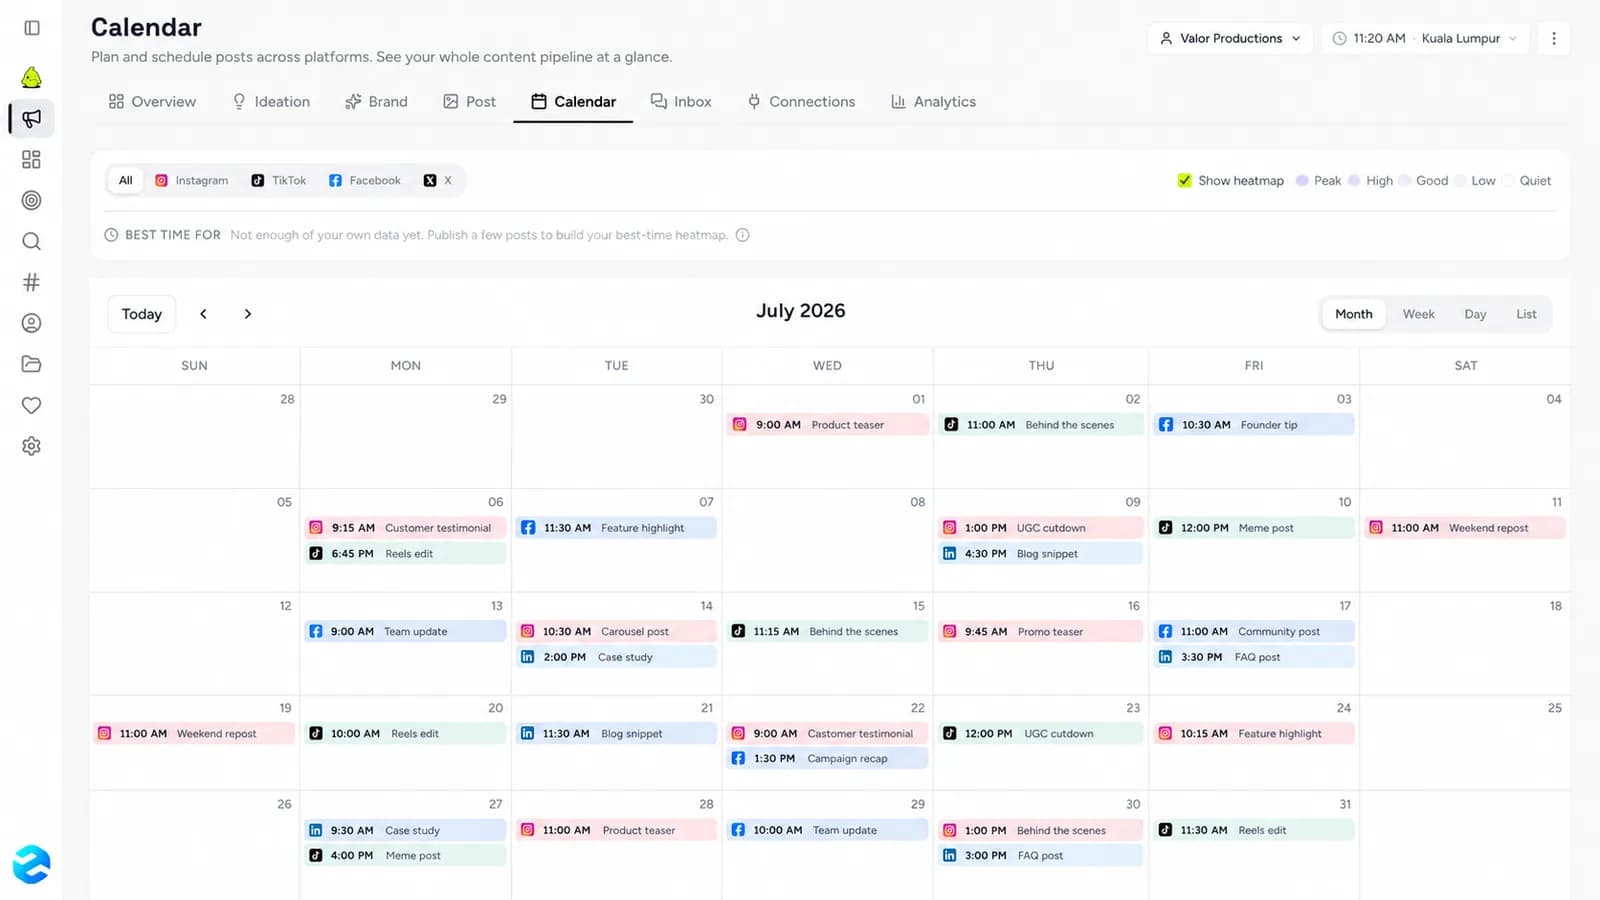
Deploy the SMM Agent: Command your SMM Agent to auto-generate the visual assets, lock in the brand tone, and schedule the posts directly to Instagram and TikTok.
Review and Clock Out: Monitor your live Marketing Analytics directly in the Dashboard and watch your reach velocity climb.
Hitting your end-of-year goals does not require seventy-hour work weeks or endless spreadsheet management. By focusing on core Top of Funnel metrics and automating your execution layer, your team can scale output exponentially. Stop babysitting your social channels and let your AI teammate handle the heavy lifting. Naise AI preps the campaigns so you can serve the results.
Frequently Asked Questions (FAQs)
What are the most important Q3 marketing metrics to track?
Managers should prioritize Brand Reach Velocity, Unpaid Amplifier Rate, and Content Testing Frequency. These metrics directly reflect your Top of Funnel health and indicate how well your organic content is capturing new audiences. Tracking these numbers ensures you are actively growing your pipeline before the heavy Q4 buying season begins.
How does tool fatigue impact marketing growth metrics?
Using too many disconnected platforms causes data silos, leading to inaccurate Marketing Analytics and delayed decision-making. When managers spend hours manually exporting and combining data from different software, they lose time that should be spent on creative strategy. Consolidating your workflow into a unified platform like Naise AI ensures your data is accurate and instantly actionable.
Why is organic reach velocity better than total follower count?
Organic Reach Velocity measures active, current momentum, whereas total followers is a static vanity metric. Follower counts often include inactive accounts and bots, which skew your true engagement numbers. Tracking velocity shows you exactly how fast your current campaigns are spreading to net-new users, giving you a real-time read on your Content Strategy effectiveness.